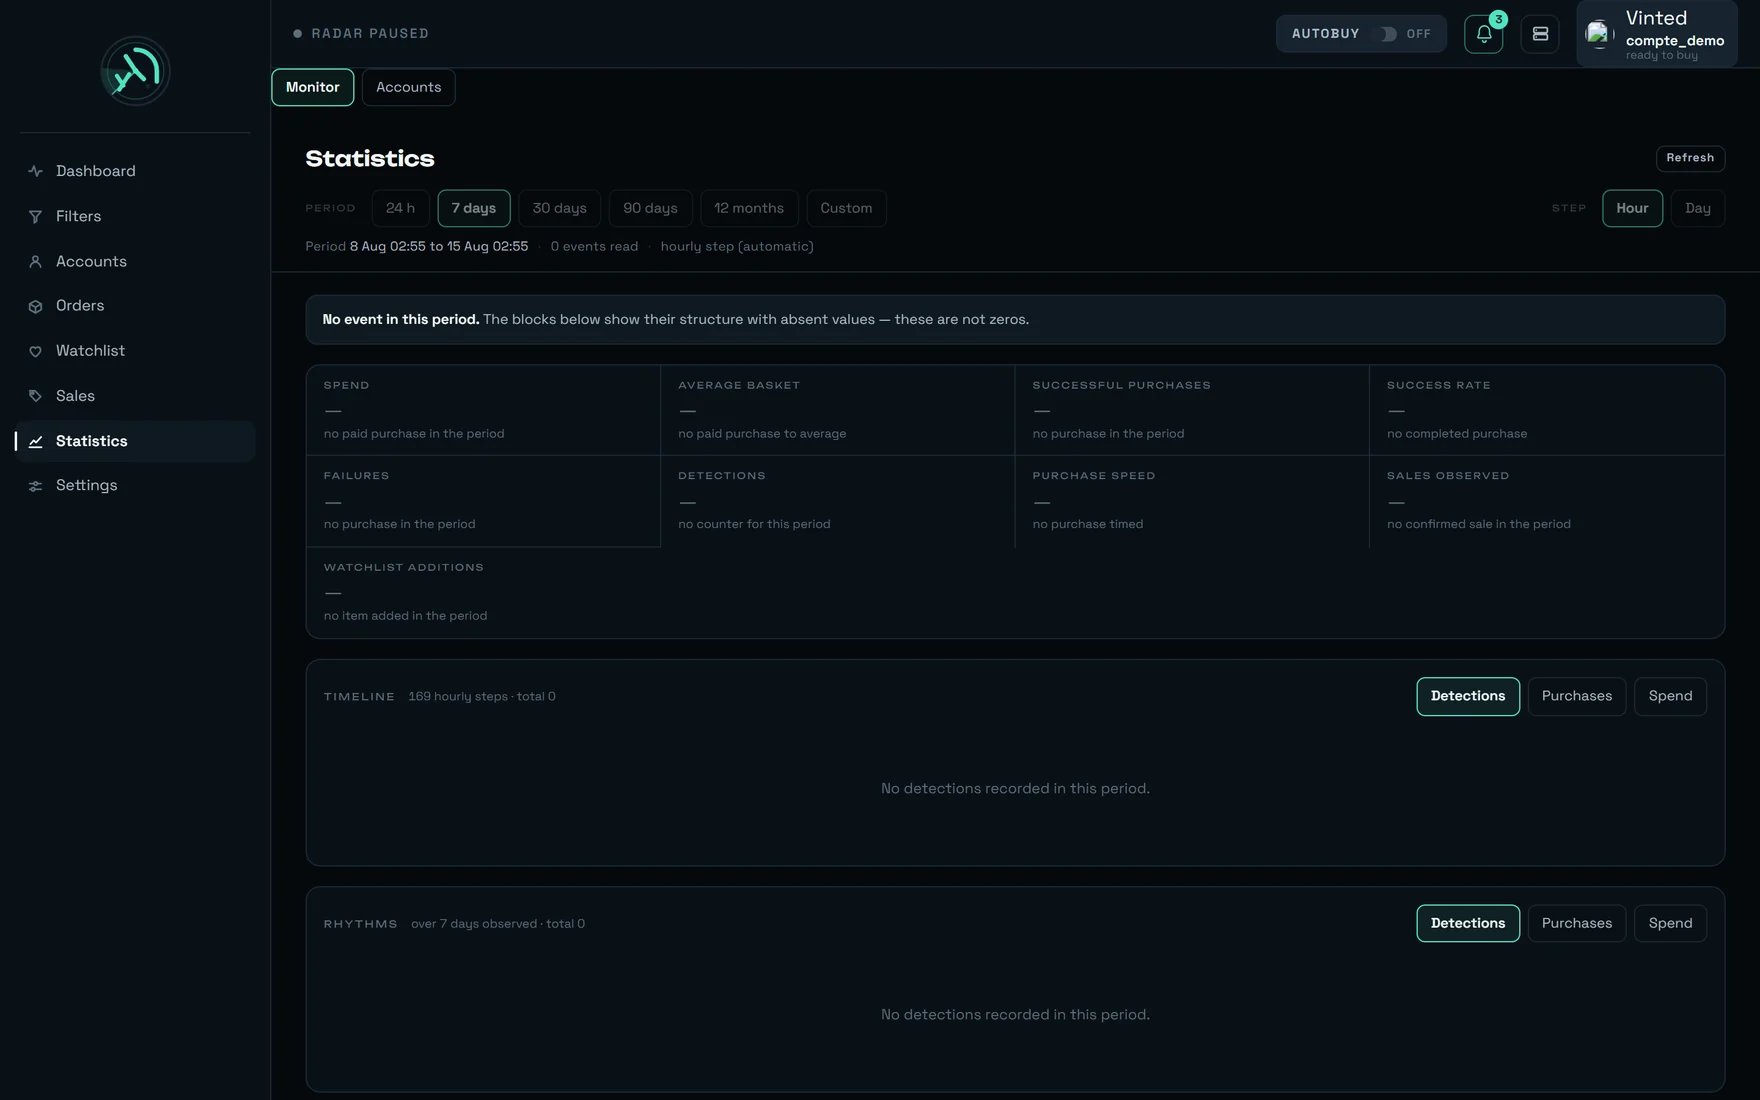
The Statistics screen, Monitor tab, “7 days” period. Here the log is empty: the blocks show their structure with “—”, never zeros.
What you are looking at
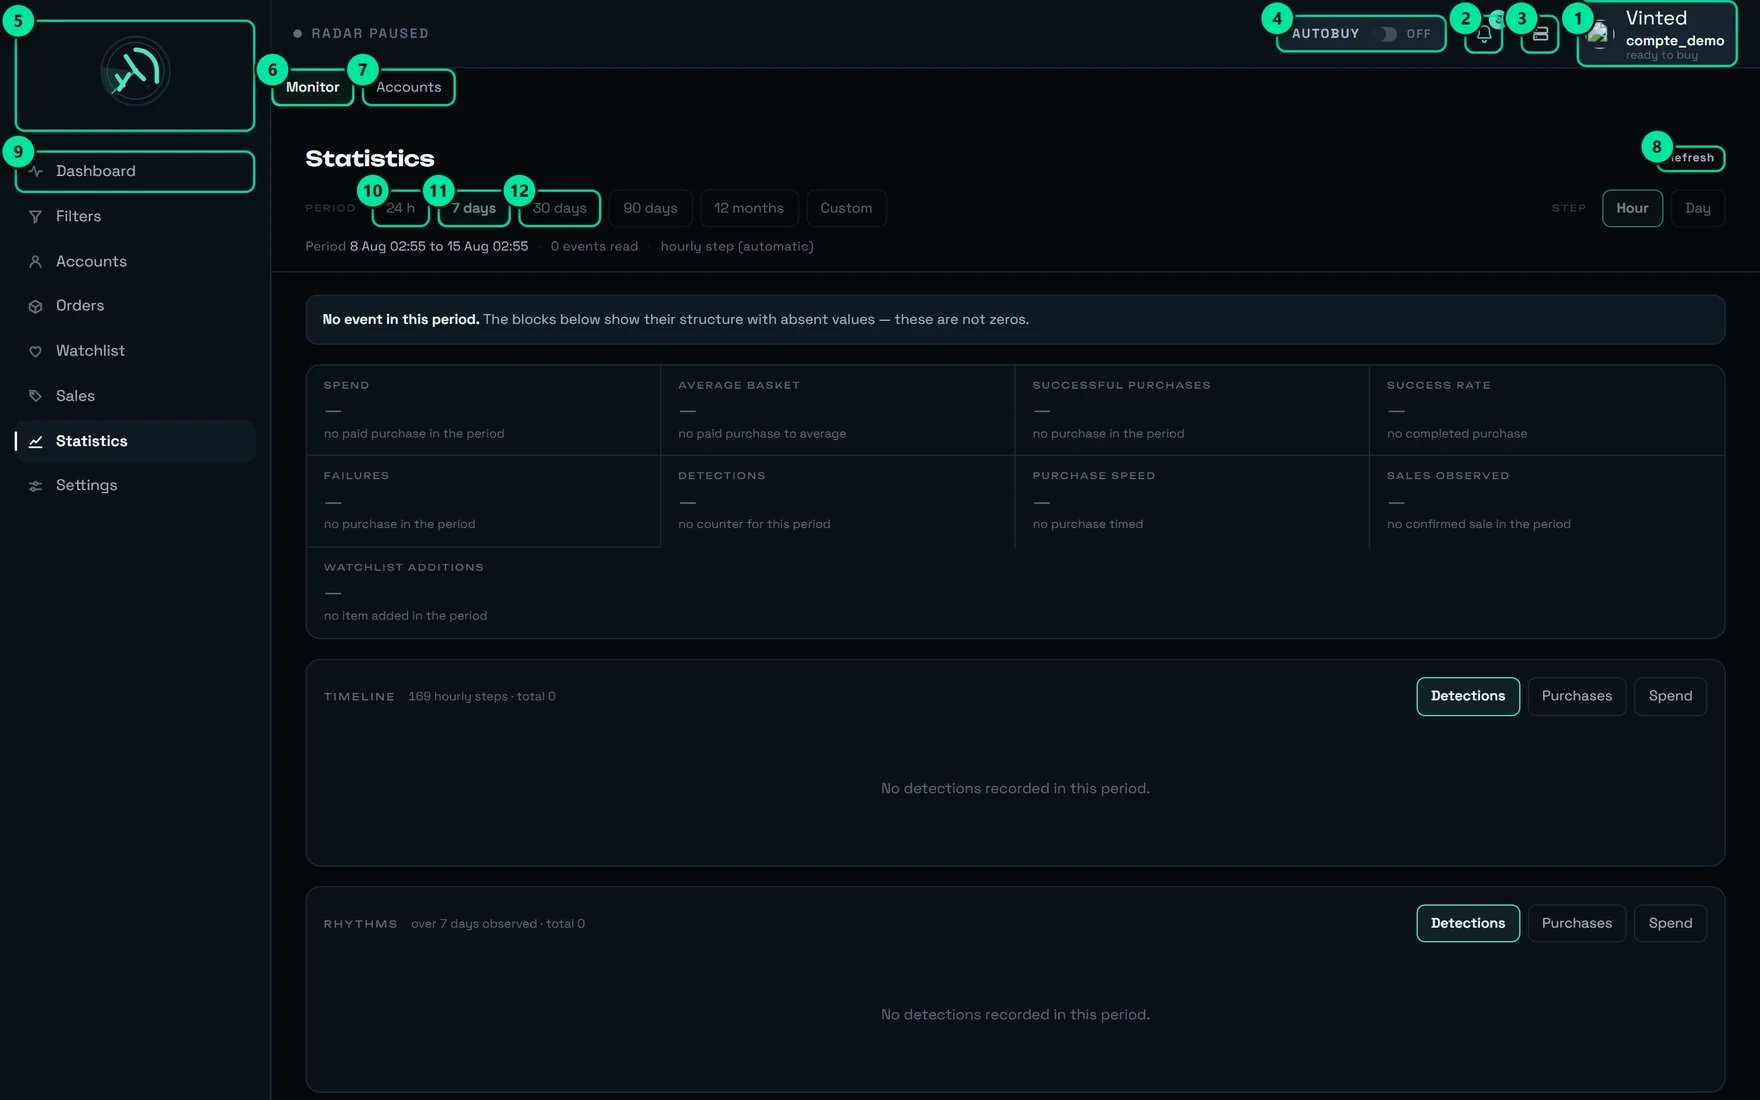
The twelve controls of the top bar and the period bar.
The two halves — and what each one costs
This is the one mechanism to understand before using the screen.- Monitor
- Accounts
Choosing the period (Monitor tab)
Pick a duration
Check the bounds line, just below
{n} events read, or “sample size unknown”), and the step (“hourly step” / “daily step”, followed by “(automatic)” as long as you have not forced it).This is the line that tells you whether the figures are worth reading. “0 events read” and a fine table of “—” say the same thing: there was nothing to measure.Only touch the STEP if you have a reason
Refresh when you want fresh figures
The “Custom” period and its invisible bound
The “Custom” period and its invisible bound
The STEP is a three-state toggle
The STEP is a three-state toggle
Before the screen is ready
Before the screen is ready
On a long period the chart can be cut — never the totals
On a long period the chart can be cut — never the totals
The nine summary tiles
Every tile is built the same way, and the third line matters as much as the second:SUCCESSFUL PURCHASES: read the sub-line, not the subtraction
SUCCESSFUL PURCHASES: read the sub-line, not the subtraction
out of {n} started counts your purchase starts. out of {n} completed · starts not counted appears when the starts cannot be tied to your filters: the screen then refuses to print a false denominator, and tells you instead of dressing it up.Either way, the figure to read is SUCCESS RATE, never the gap between the two numbers.If you run dry tests, the sub-line adds · including {n} in simulation.PURCHASE SPEED: the figure that decides is the second one
PURCHASE SPEED: the figure that decides is the second one
typically · 9 times out of 10 under {p90} · over {n} purchases. The first figure is the usual case; the second — “9 times out of 10 under…” — is the one that counts, because it describes your bad days, and bad days are when an item is lost.Bank confirmation is outside this measurement: the tile times the tool, not your bank.FAILURES: what the reason shown actually means
FAILURES: what the reason shown actually means
top reason: {motif}. The labels are written from failures actually observed. The most frequent ones:- “Un autre acheteur a payé en premier” — another buyer paid first; lost in the race.
- “L’article était déjà parti” — the item was already gone when we tried.
- “Vinted vérifiait encore l’annonce” — Vinted was still checking the listing; it was not buyable yet. That is a postponement, not a failure.
- “Ce compte n’était plus connecté” — this account was no longer connected; fix it on the Accounts screen.
- “La validation bancaire n’a pas été faite à temps” — the bank confirmation was not completed in time; you were the one being waited for.
SPEND when several currencies are involved
SPEND when several currencies are involved
{n} purchases · plus {autres} (currencies not converted).DETECTIONS: a pace, not a stock
DETECTIONS: a pace, not a stock
≈ {n} per hour. That is the figure to compare from one week to the next: the raw total depends on how long the period is, the pace does not. If the pace collapses while your filters have not changed, look first at the radar state, top left.The four blocks below the summary
TIMELINE — when it happened
TIMELINE — when it happened
169 hourly steps · total 0. Hovering a point gives the detail: the step label, the value, then · {n} purchases and · {n} failures.When the metric shown is not “Purchases”, a legend appears: “The mark below the baseline shows the steps that carried a purchase.” It is the fastest way to see at what hours a purchase actually landed while looking at your detections.Empty: No {metrique} recorded in this period.RHYTHMS — at what hours it happens
RHYTHMS — at what hours it happens
peak at {h}:00 — {v}, peak on {j} — {v}. Below the bands: “less … more”, then “local time · the circled cell is the peak”.To the left of the title, the sample: over {n} days observed or over {n} h observed. Always read the peak together with its sample — a “peak at 21:00” over 24 h of observation is one evening, not a rhythm. Count at least two or three weeks before turning it into a habit.DETECTIONS BY FILTER GROUP
DETECTIONS BY FILTER GROUP
{erreur}).”, or its fallback “Groups unavailable.”BUSIEST FILTERS and SPEND BY BRAND
BUSIEST FILTERS and SPEND BY BRAND
{n} filters for this period have been deleted since.” Empty: “No detection tied to a filter in this period.”SPEND BY BRAND — columns BRAND · TOTAL · PURCHASES · AVERAGE · SHARE, note: “Simulated purchases are excluded. “(inconnue)” is not a brand: it is a brand that was not read in time.” Empty: “No purchase charged in this period.”Both tables show only 8 rows; beyond that, a Show all {n} rows ↔ “Collapse” button appears.
Cells of unequal intensity, side by side. A rhythm has no other shape.
The log footer
Below the blocks, a discreet line says what state the measurement itself is in. It is the only part of the screen that talks about its own reliability.The Accounts tab
This half does not use the log: it queries real Vinted accounts and hands you back what Vinted answers.Choose the reading scope
{nom} — not connected: nothing can be read.Choose the period — before you click
Let the read finish
The seven figures
The chart, the comparison, and the honesty footer
- “Spend and completed orders”: bars are spending, the line is completed orders, and the note says it — “independent scales”. So never read a crossing of the two as an event. Empty: “No dated order in this period.”
- “Account comparison” only appears from two accounts onwards. Bars are scaled to the biggest spender: a full bar means “the most”, never “a lot”. Each row details
{n} orders,{n} completed, its rate, and where applicable· history truncated. - The honesty footer states what is missing rather than rounding it away:
History truncated: the totals cover {n} pages read, not the whole history.,{n} orders with no readable date: counted in the totals, absent from the chart.,Not read: {liste}.
The VINTED ACCOUNTS table
Right at the bottom, a live read, with no period: columns ACCOUNT · VINTED RATING · ITEMS FOR SALE · FOLLOWERS, context{n} accounts connected · live.
Its note holds for the whole page: “ “—” marks a value Vinted did not return, never a zero.”
Empty: “No account connected. Connect one from the Accounts screen.” If it is refused: “The account list could not be read ({erreur}).”, and per row “This account could not be read.” in the tooltip of the dash.
The states of the screen
Actually using it: where to start
This screen answers four questions, and each one has one entry point. Do not sweep the page top to bottom: start from your question.The Monday review — 5 minutes, every week
The Monday review — 5 minutes, every week
- Monitor, 7 days period. Read the bounds line: how many events were read?
- DETECTIONS: has the pace,
≈ {n} per hour, moved since last week? - SUCCESS RATE and the FAILURES reason. If the reason is “Un autre acheteur a payé en premier”, you are in a race, not in a breakdown.
- BUSIEST FILTERS: spot the filters with plenty of DETECTIONS and zero PURCHASES.
- Log footer: is the dropped-measurements counter still at 0?
The “I keep missing items” investigation
The “I keep missing items” investigation
- Monitor, 30 days period, Purchases metric in TIMELINE: are purchases spread out, or bunched onto a few days?
- Switch the metric back to Detections: the mark below the baseline shows the steps that carried a purchase. Long stretches of detections without a mark point at the hours you are missing.
- RHYTHMS: do those hours match your peak? If they do, that is when automatic buying needs to be armed.
- PURCHASE SPEED: if the “9 times out of 10 under…” figure is high, time is lost inside the purchase itself; if it is low, the race is what you lose, not the machinery.
- FAILURES: the reason settles it between “lost in the race” and “fixable at your end”.
The money check before invoicing
The money check before invoicing
- Accounts, scope All accounts, the longest period you care about — then narrow down, never the other way round.
- Read Confirmed spend, not Spend: orders still under way can fail or be cancelled.
- Look at the honesty footer: “History truncated”, “orders with no readable date”, “Not read: …”. A total sitting on a truncated history is not a total.
- Mentally add roughly €4 per order (measured: +€4.09) — or get the real cost from Orders.
- Cancellations: read only the sub-line
including {n} requested from rega. The big figure mixes cancellations with payments that did not go through.
Our advice
1 — Create a filter before coming here for figures. Statistics are bounded to your filters: no filter, no statistics — and that is correct, not a breakdown. It is also what guarantees that no other customer will ever see a single one of your figures. 2 — On Accounts: start wide, then narrow down. Narrowing a period you have just read is immediate; widening it makes you wait for a new read. “90 days” then “7 days” costs you one wait; the other way round costs two. 3 — Do not bounce between the two tabs. Every return to Accounts starts a fresh read of your connected accounts. Nervous tab-switching makes you wait all over again for figures you already had. 4 — Read SUCCESS RATE, never the “started minus successful” subtraction. When the sub-line saysout of {n} completed · starts not counted, the denominator is not comparable — the screen flags it instead of hiding it. The rate itself stays correct.
6 — If your purchases “feel slow”, look at PURCHASE SPEED before writing to support. This tile stops at the payment, bank confirmation excluded. If it is low and your purchases still drag, the wait is at your bank. The figure to quote in a support message is the “9 times out of 10 under…” one, never a general impression.
7 — Before deleting a productive filter, write its figures down — or disable it instead. Deleting wipes its BUSIEST FILTERS row for good; a disabled filter keeps its past. It is the only irreversible action this screen is subject to.
8 — Hunt down the “plenty of DETECTIONS, zero PURCHASES” filters. They are the ones filling your feed without converting anything. Two ways out: tighten the filter in Filters (brand, price, condition), or accept that it is there to watch the market and file it in a separate group so you stop confusing it with your buying filters.
9 — Use RHYTHMS to decide on your availability, not to describe your week. The cells are in local time, and the peak only means something with its sample (over {n} days observed). Once the peak is identified, that is when a manual purchase is worth the most — and above all, that is when automatic buying needs to be armed already, since it runs on our servers even while you sleep.
10 — If the “Shortened timeline” banner appears, click “Day”. It can only appear if you forced the Hour step on a long period. And only the chart is cut: the totals stay complete.
11 — Watch the log footer like a warning light. As long as it shows no “measurements dropped”, your totals are complete. As soon as it does, stop comparing periods with each other: one of them is truncated, and the “drop” you would read never happened.
12 — For a real cost, leave this screen. The “Spend” of the Accounts tab is item prices. The Orders screen carries what you actually paid, postage and buyer protection included.
What surprises people
The group ranking does not move when you change the period
The group ranking does not move when you change the period
A dry test counts as a “successful purchase” but not as spending
A dry test counts as a “successful purchase” but not as spending
· including {n} in simulation) and stays out of SPEND, AVERAGE BASKET and SPEND BY BRAND. So a flattering success rate can be a dry-test rate — check the sub-line.The two success rates do not measure the same thing
The two success rates do not measure the same thing
“SALES OBSERVED” is lower than what you saw go
“SALES OBSERVED” is lower than what you saw go
“WATCHLIST ADDITIONS” and its sub-line do not cover the same window
“WATCHLIST ADDITIONS” and its sub-line do not cover the same window
{n} tracked in total is not. It is written in its tooltip, and it is intended: the total is a state, an addition is an event.“(inconnue)” appears in SPEND BY BRAND — and stays in French
“(inconnue)” appears in SPEND BY BRAND — and stays in French
No automatic refresh
No automatic refresh
One tile refuses to show a flattering zero
One tile refuses to show a flattering zero
out of {n} completed · starts not counted rather than writing “out of 0 started”. A screen that shows an odd figure rather than a false one is doing exactly its job.On a phone
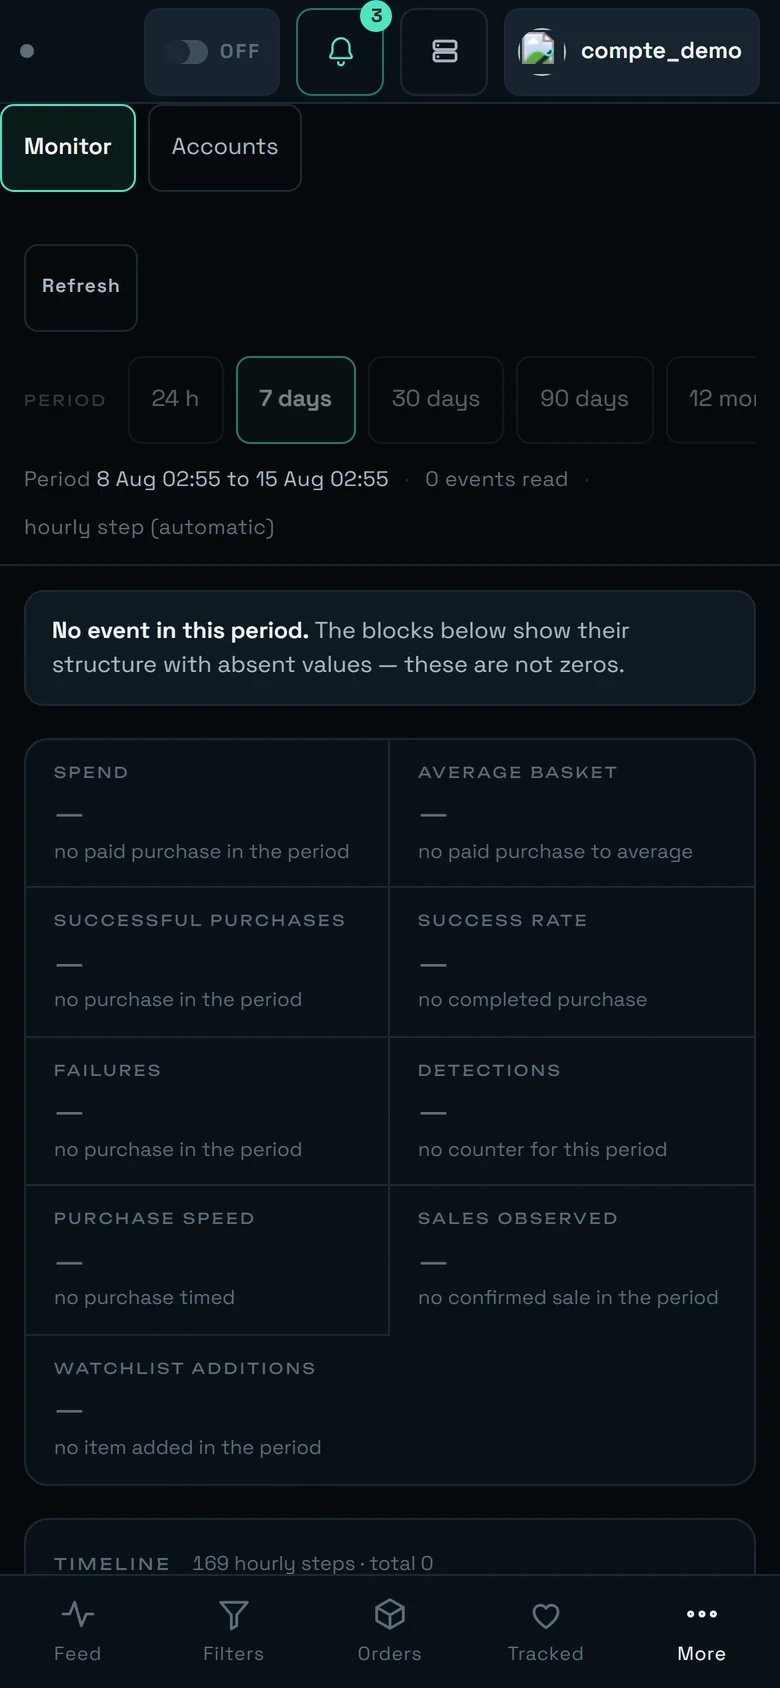
The Statistics screen at 390 px wide: controls on a single scrolling row, tiles in two columns.
- The row of periods SCROLLS, it is not cut off. “12 months” and “Custom” are off to the right, the STEP selector at the far end. Swipe it with your finger.
- The “Statistics” title disappears on a narrow screen — on purpose: the fixed header would otherwise eat a large share of a phone screen, and the figures come first.
- The nine tiles move to two columns, in the same order.
- Navigation moves to the bottom: Feed · Filters · Orders · Tracked · More. Statistics is reached through More.
- On a small screen, tiles and the log footer stay comfortable to read; the five-column tables (brands, groups) are happier on a large screen.
What this screen does not do yet
- No export — no CSV, no image, no clipboard. If you track a series, copy the figures out.
- No period-over-period comparison: no “vs last week”, no trend arrow.
- Only one failure reason is shown (
top reason: {motif}); the full ranking of causes exists but is not displayed here. - The time between a detection and a confirmed purchase is measured, but not shown yet.
- Two sentences in the Accounts footer, and the failure reasons, are not translated yet — they stay in French even when the interface is in English.
- The layout is drawn for a phone and for a large screen; on intermediate widths (tablet) it is not at its best yet.